
To build “Graph My Run,” Phil Miller chose Sandvox. He chose the “Blueball Gravitas Blue” design for the site. People may want to visit the site if they are looking for Graph Analyze GPS Running File.
Sandvox features used for this site:Custom Collection Index, Site Map, Contact Form, Editing HTML of text, Raw HTML Object, Code Injection
Describe your website.
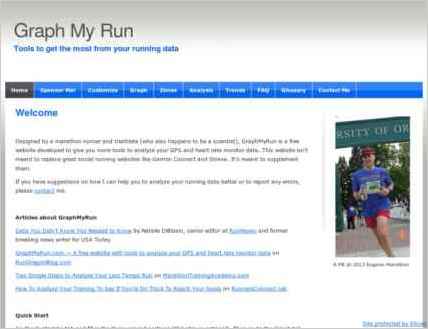
GraphMyRun is a simple-to-use tool for runners to graph and analyze their GPS watch and heart rate monitor data. With it, runners can easily do a deep dive into their data to self-coach their training runs.
Who is the target audience for your website?
Long distance runners who are training with a specific goal in mind: like running a PR (personal record) or trying to BQ (qualify for the Boston Marathon)
What is the advantage of your website over others?
GraphMyRun is free, simple to use, and provides important feedback that other running websites don't.
Why did you use this Sandvox design?
I choose Blueball Gravitas Blue because it is simple and elegant. The simple design reflects the simplicity and ease of use of GraphMyRun and blue is a color that people associate with trust.
What techniques did you use to build this website?
I use JQuery for my javascript code and I make extensive use of Highcharts graphing libraries. They provide a wonderful graphing library.

This website was created by Phil Miller of Dallas, Texas, USA.
www.SandvoxSites.com/3246
